Water Quality Data
CMAR collects high-frequency (recorded every 10 minutes to 1 hour) temperature, dissolved oxygen, salinity, and sensor depth data through the Coastal Monitoring Program.
Data Collection
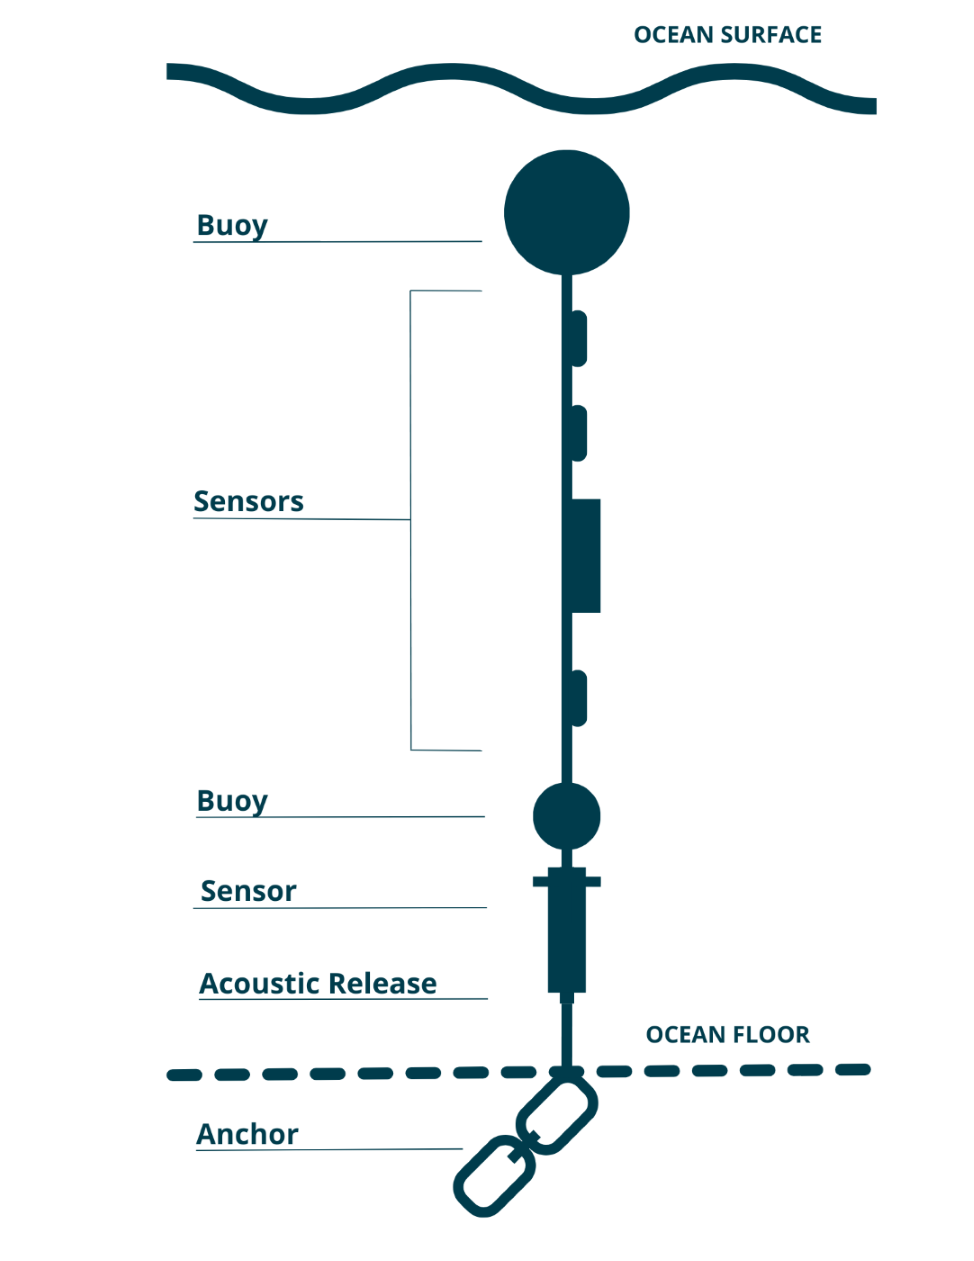
Water Quality data is collected using moorings referred to as “sensor strings”. A typical sensor string configuration consists of a rope attached to the seafloor by an anchor and suspended by a sub-surface buoy, with sensors attached at various depths (Figure 1). Most strings deployed since 2018 are attached to the anchor by an acoustic receiver with a release mechanism, which allows the mooring to be retrieved without a diver or winch. The receiver also logs detections of tagged animals including great white sharks, sturgeon, and tuna for the Ocean Tracking Network.
Characteristics of the station location (e.g., depth, bottom type, and currents) and stakeholder needs dictate the string design (e.g., anchor weight and number/type of sensors). Sensor strings are generally deployed 200 m to 1000 m from shore, in depths up to 75 m. Temperature sensors are typically attached at 2, 5, 10, 15, 20 (etc.) m below the surface at low tide, although sensors may be placed at other depths for site-specific reasons. At least one dissolved oxygen sensor is included on most strings, typically at 5 m. At the request of industry, salinity sensors are also included at stations near proposed and existing shellfish aquaculture leases. Some of the sensors used to measure these variables also measure sensor depth, and CMAR has also processed and published this opportunistic depth data.
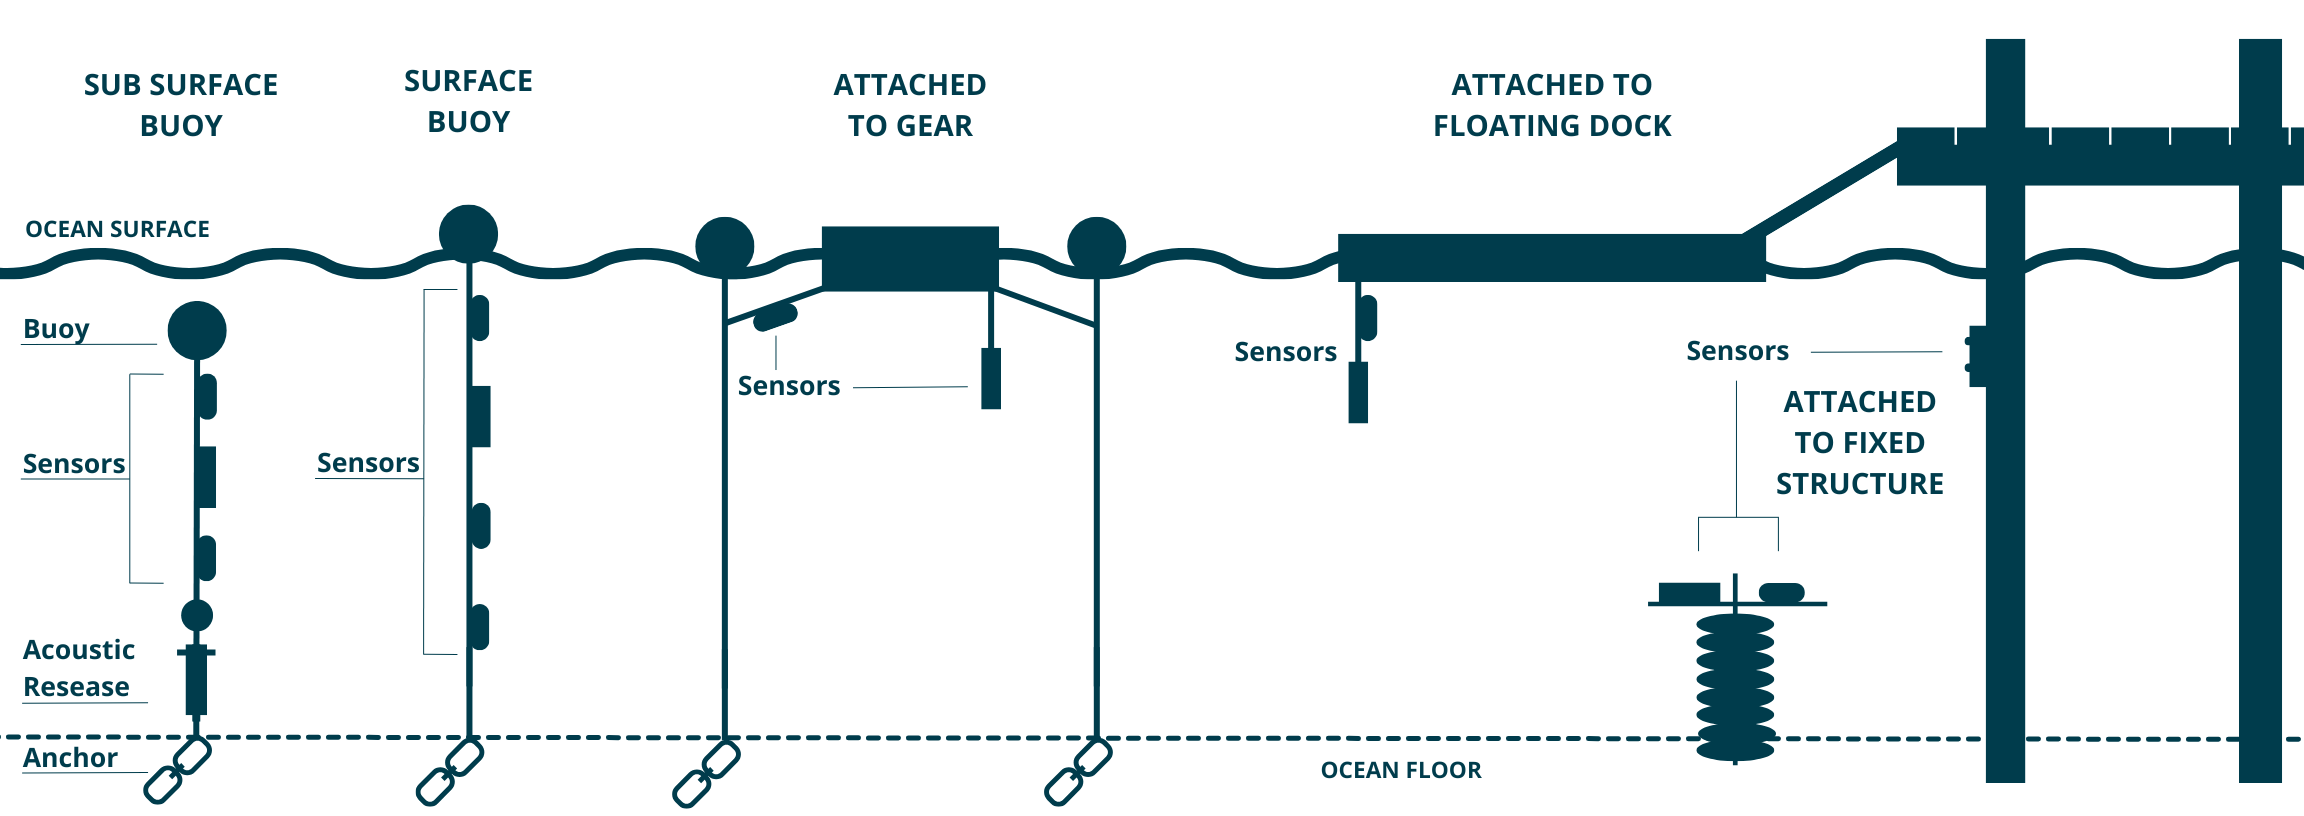
The sensor string configurations are described in Table 1 and shown in Figure 2. For configurations that float with the tide, sensors remain at a roughly constant depth below the surface. For fixed configurations, the sensor depth below the surface changes with the tide.
| Configuration | Description | Floats with tide? |
|---|---|---|
| Sub-surface buoy | Attached to a sub-surface buoy. Typically has an acoustic release, but is sometimes retrieved by a diver or drag line. | No |
| Attached to fixed structure | Attached to a wharf, bridge, or pole. | No |
| Surface buoy | Attached to a surface buoy. | Yes |
| Attached to gear | Typically attached to aquaculture gear, but may be attached to another floating structure. | Yes |
| Floating dock | Attached to a floating dock. | Yes |
| Unknown | Configuration not indicated in the deployment log. | Unknown |
Sensor Validation
Pre-deployment
Sensors are calibrated by the manufacturer. Prior to deployment, sensors are checked to ensure they are still reading within their stated accuracy. This is called a Calibration Validation Test or “Cal-Val” test.
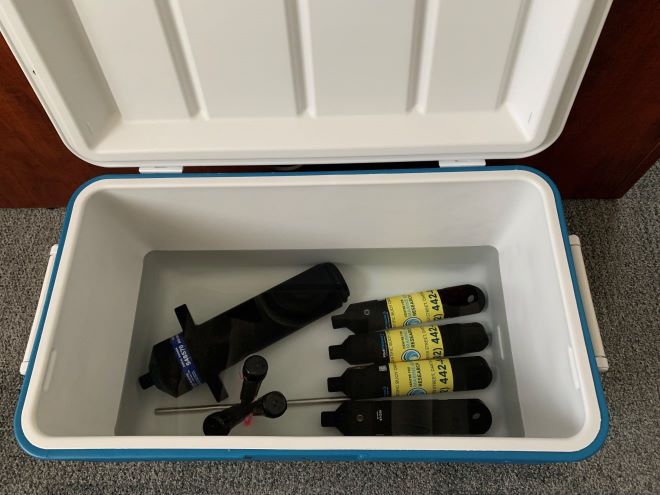
For a Cal-Val test, each sensor is set to record in 10–15 minute intervals. Sensors are submerged in a cooler of water for at least 24 hours (Figure 3). Seawater is used for tests with salinity sensors.
After the recording period, data from all sensors is offloaded. The observations are binned into 15-minute intervals, and the median value for each interval is calculated. The acceptable measurement range is the median ± the accuracy defined in the sensor manual. Sensors with >10% of measurements outside of the acceptable range are re-validated. A temperature or salinity sensor that fails two consecutive Cal-Val tests is sent to the manufacturer for maintenance.
Dissolved oxygen sensors are included in the Cal-Val test, but results are inconsistent: sensors in the same cooler at the same time show different magnitudes and trends. Because retesting every sensor that fails is not feasible, dissolved oxygen sensors are deployed regardless of Cal-Val results. The data undergo strict quality control on retrieval.
Code to assess the results of the Cal-Val Test is published in CMAR’s R package calval. The CMAR Sensor Validation App provides a user interface for running the code.
Post-deployment
Retrieved sensors undergo a post-deployment Cal-Val Test, which follows the same procedures as the pre-deployment Cal-Val Test. The post-deployment tests identify sensor drift, biofouling, and damage. The results of the post-deployment Cal-Val test are not currently included in the published data; however, they may be included in future releases as an additional Quality Control flag.
Data Access
See the Data Products page for information on how to access the Coastal Monitoring Program data.